The Modern Power of a Structured Infographics Layout
In a world saturated with information, the battle for attention is fierce. You have data, a story, or a complex process to explain, but a wall of text is no longer the key to engagement. The visual shortcut—a well-designed infographic—has become essential. However, creating one that truly resonates requires more than just putting icons next to bullet points. It demands a coherent, strategic Infographics Layout. This foundational structure is the invisible framework that turns raw information into compelling visual communication.
What Makes a Layout Modern?
Modern infographics are defined by clarity, flow, and aesthetic purpose. Gone are the days of cluttered, chaotic designs that overwhelm the viewer. A contemporary Infographics Layout guides the eye logically from introduction to conclusion, using visual hierarchy to prioritize information. Think of it as the roadmap for your data’s journey. Key characteristics include clean lines, deliberate spacing, a balanced mix of visual elements (like charts, icons, and illustrations), and a thoughtful use of color to create distinction and emphasis.
This modern approach isn't just about looking sleek. It serves a critical function: enhancing comprehension. A chaotic layout forces the reader to decode the design itself before understanding the content. A modern, structured layout does the opposite. It removes barriers, allowing the core message to be absorbed quickly and memorably. This is why templates built around these principles are so valuable—they provide a proven, professional starting point, saving you from reinventing the wheel.
The Core Components of a Successful Layout
Every effective infographic is built on a set of interdependent components. The layout is the master plan that organizes them.
- Header or Title Zone: This is the anchor. It must immediately establish the topic and often sets the visual tone.
- Introduction or Key Insight Area: A brief, powerful statement or statistic that hooks the viewer and summarizes the "why" of the infographic.
- Data Visualization Sections: Where charts, graphs, and progress bars live. The layout ensures these are sized and positioned for comparative ease, not crammed together.
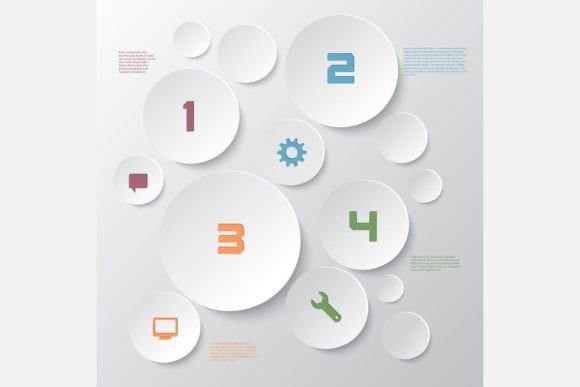
- Iconographic Pathways: Sequences of icons with short text that explain steps, lists, or features. A good layout creates a clear visual path—linear, circular, or branched—for these sequences.
- Supporting Text Blocks: Necessary explanations or quotes. Modern layouts treat text as a visual element, using spacing and typography to integrate it seamlessly.
- Conclusion or Call-to-Action Space: The natural endpoint, often summarizing the takeaway or prompting further engagement.
Why a Professional Template Changes Everything
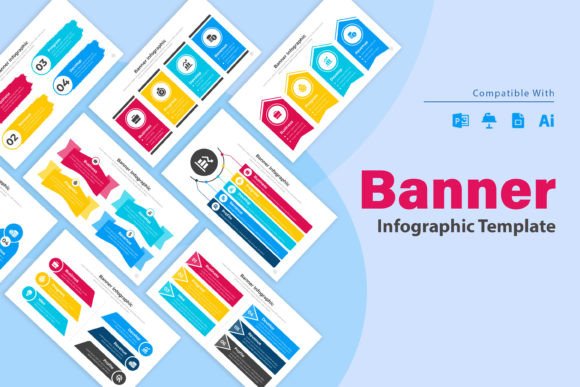
Starting with a professionally designed Infographics Layout template is like having a master architect draft your blueprint. Consider a stylish template that includes a vector EPS file and a high-resolution JPG. The vector file is the magic key. It allows you to scale your design to any size—from a tiny social media badge to a massive conference poster—without any loss of quality. The 300 DPI JPG provides a ready-to-use raster image for contexts where vectors aren't needed.
This dual-file approach speaks directly to modern, multi-platform workflows. Your core message needs to be consistent whether it's on a website blog, a Facebook post, a printed flyer, or a brochure. A template built on a strong modern layout ensures visual consistency across all these mediums. You’re not creating ten different designs; you’re adapting one powerful, cohesive visual structure to different formats.
Practical Benefits Across Projects and Industries
The application of a ready-to-use modern Infographics Layout is virtually limitless.
For marketing teams, it speeds up campaign production. A social media post about product features, a flyer for an event demographic breakdown, and a brochure detailing service steps can all originate from the same template, ensuring brand coherence. Educators and trainers can use it to transform dry curricular content or complex procedures into engaging learning materials. Non-profits can visualize impact data for reports and fundraising appeals more compellingly.
The benefit is twofold: immense time savings and a guaranteed level of design professionalism. Even individuals with basic graphic software skills can produce outputs that look polished and effective, because the hardest part—the foundational layout and aesthetic balance—is already expertly resolved.
Choosing and Using an Infographics Layout Template
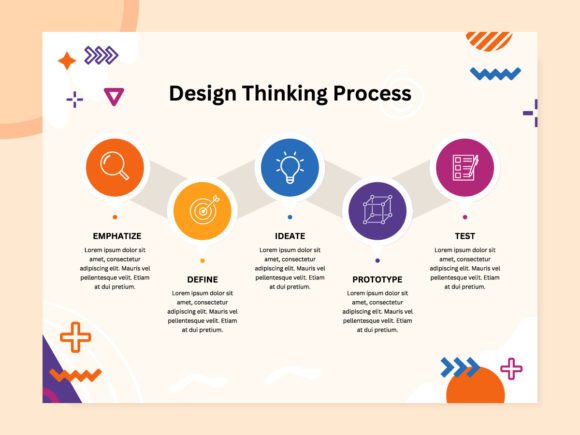
Before selecting a template, consider your primary content and audience. Is your data heavily statistical, requiring space for multiple charts? Is it more process-oriented, needing a clear sequential pathway? Look for a layout whose structure naturally accommodates your content type.
Once you have your template, using it effectively is a process of content-first adaptation. Populate the structure with your information, but respect the layout’s logic. Don’t force a 10-step process into a space designed for 5 key stats; you might need to adjust, but the template’s underlying grid and balance should guide you. Use the color palette and font suggestions (if included) to maintain visual harmony. The goal is to leverage the template’s intelligence, not to fight against it.
Remember, the Infographics Layout is a tool for communication, not decoration. Every adjustment you make should ask: does this help the viewer understand faster and remember longer?
Common Pitfalls to Avoid
Even with a great template, missteps can dilute its power.
- Overcrowding: The temptation to add "just one more" statistic can break the layout's clean flow and create clutter.
- Ignoring Visual Hierarchy: Making everything the same size visually kills the narrative. Use the layout’s natural emphasis points for your most important data.
- Typeface Anarchy: Introducing too many fonts disrupts unity. Stick to a simple, readable combination.
- Color Confusion: Using colors solely for decoration, rather than for categorization or emphasis, can mislead the eye.
A modern template helps you avoid these by providing a balanced starting point, but conscious discipline is still required.
The Role in Today's Visual Communication Ecosystem
We consume information in a glance. On scrolling social feeds, in crowded email inboxes, and on fast-loading webpages, the infographic is a unit of concentrated understanding. A robust, modern Infographics Layout is what ensures that unit works. It transforms raw information into a visual asset that can compete for attention, be shared across platforms, and stand out in a sea of content.
It fits perfectly into agile content creation workflows. Whether you're a solo creator or part of a team, having a set of trusted layout templates in your arsenal means you can respond to communication needs quickly without sacrificing quality. It elevates your output from simple graphics to strategic visual tools.
Ultimately, investing in or learning to create with a strong infographics layout isn't just about making things look good. It's about making your information matter. It’s about ensuring that your hard-earned data, your important process, or your compelling story doesn’t get lost—but instead, gets seen, understood, and remembered.