Table of Content Infographics: A Design Asset for Clear Communication
In a world saturated with information, clarity is a competitive advantage. The ability to distill complex data, processes, or narratives into a clear, visual pathway is invaluable for anyone communicating with an audience. This is where the concept of a Table of Content Infographic comes into play. It’s more than a simple list; it’s a visual roadmap designed to guide a viewer through your content’s structure, making it immediately accessible and engaging.
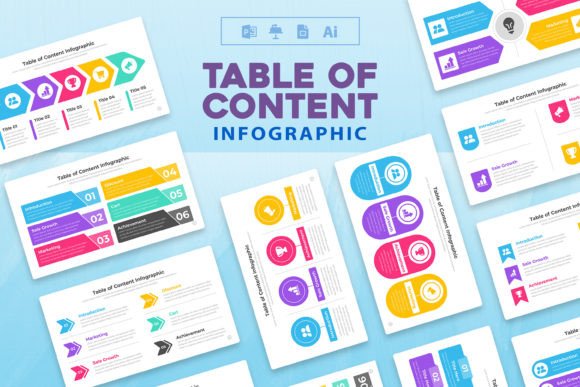
A well-crafted Table of Content Infographic possesses a distinct personality: it is organized, confident, and helpful. Its style leans towards clean, modern typography with a strong emphasis on visual hierarchy. Think of balanced layouts where section titles, numbers, and perhaps brief descriptors are arranged not just as text, but as integrated graphic elements. The overall appeal lies in its promise of order. It tells your audience, “What you’re about to explore is well-structured and easy to navigate,” building trust and anticipation before they dive into the details.
The Versatile Applications of a Visual Table of Contents
This tool finds its strength across a remarkably wide range of projects. For marketers, it can transform a lengthy whitepaper or report into an attractive, shareable social media graphic that highlights key takeaways. Educators and publishers can use it to outline course modules or book chapters, providing students and readers with a clear learning journey. In brand identity work, a company might use a stylized table of contents infographic in a corporate presentation deck to outline their story, values, and services in a memorable way.
The medium is equally flexible. It shines in digital design, such as website landing pages for online courses or interactive PDFs. In print design, it elevates brochures, magazine features, and physical reports. For bloggers and content creators, it serves as a powerful visual within a long-form article or as a standalone graphic to promote a series. Essentially, any project that involves sequencing information—from a small business’s service breakdown to a crafter’s multi-step tutorial—can benefit from this approach.
Beyond Layout: Influencing Perception and Engagement
Implementing a Table of Content Infographic isn’t merely about aesthetics; it has tangible effects on how your content is perceived and consumed. First, it establishes an immediate visual hierarchy. By graphically emphasizing sections, you control the flow of attention, guiding the viewer logically from start to finish. This enhances overall readability of the accompanying content, as the audience already has a mental framework for what’s coming.
From a brand perception standpoint, this tool signals professionalism and forethought. It shows you’ve organized your ideas carefully, which builds credibility. Consistency in using such a styled element across different publications or platforms strengthens brand recognition. Finally, it boosts audience engagement. A visually interesting table of contents is more inviting than a plain text list. It can pique curiosity, encourage shares, and increase the likelihood that your audience will actually consume the full content, because the path seems manageable and appealing.
Practical Guidance for Implementing Your Infographic
Creating an effective Table of Content Infographic requires a blend of strategic thinking and design sensibility. Start by evaluating the project fit. Is your content lengthy, multi-faceted, or process-driven? If so, a visual table of contents is a strong candidate. Next, consider the template or tools you’ll use. A flexible template, editable in common software like PowerPoint, Google Slides, or Canva, can save immense time while providing a professional foundation.
When designing, pay close attention to font pairing. The titles or numbers in your infographic might use a bold, distinctive display font for impact, while the supporting text should lean on a clean, highly readable sans serif font. This contrast creates dynamism while maintaining clarity. Review all included styles in your chosen template or font set to ensure they provide the versatility you need—perhaps different weight options for varying emphasis.
Readability considerations are paramount. Even in a graphic format, the text must be legible at various sizes, especially if the infographic will be used on social media or in print. Test your design by squinting at it or viewing it on a smaller screen; the hierarchy should remain apparent. Lastly, always confirm commercial licensing for any fonts or design assets you use, especially if the final product will be for paid client work or your own business promotion. A genuine premium font or template with clear commercial rights provides peace of mind and supports professional integrity.
Real-World Examples and Final Recommendations
Imagine a boutique skincare brand launching a new regimen. Instead of a bulleted list, they could use a Table of Content Infographic showing four sequenced steps: “Purify,” “Prep,” “Treat,” “Protect,” each with a small icon and a concise sub-line. This becomes a central graphic for their campaign, used on their website, in email newsletters, and on product packaging inserts. It’s not just information; it’s part of the brand’s sleek, educational identity.
For a practical recommendation, approach your infographic as a narrative device. What is the story of your content? The infographic should visually tell that story’s structure. Use color and spacing intentionally to group related sections. Don’t overcrowd; the goal is clarity, not complexity. And remember, the template you choose should be a starting point, not a constraint. Customize it to reflect your project’s unique tone—whether that’s playful, authoritative, or minimalist.
Ultimately, the Table of Content Infographics concept is about respecting your audience’s time and cognitive load. By providing a beautiful, clear map upfront, you enhance their experience, strengthen your message’s impact, and elevate the perceived quality of your work. It’s a simple principle with profound effects: when you show people the path clearly, they are far more likely to enjoy the journey.